


In the absence of a crystal ball, candlestick patterns are the next best thing. Here’s why market-timing traders rely on them, as well as an explanation of 12 basic candlestick patterns you need to know.
An invention of 18th-century Japanese rice traders, the candlestick chart is a useful tool used by traders and investors to track price movements of the market they are interested in.
This is a wonderfully versatile tool that elegantly and cleanly packs data for specific time frames into single price bars. At a glance, you can see important details such as the opening and closing prices of the day, as well as how high or low prices went during trading.
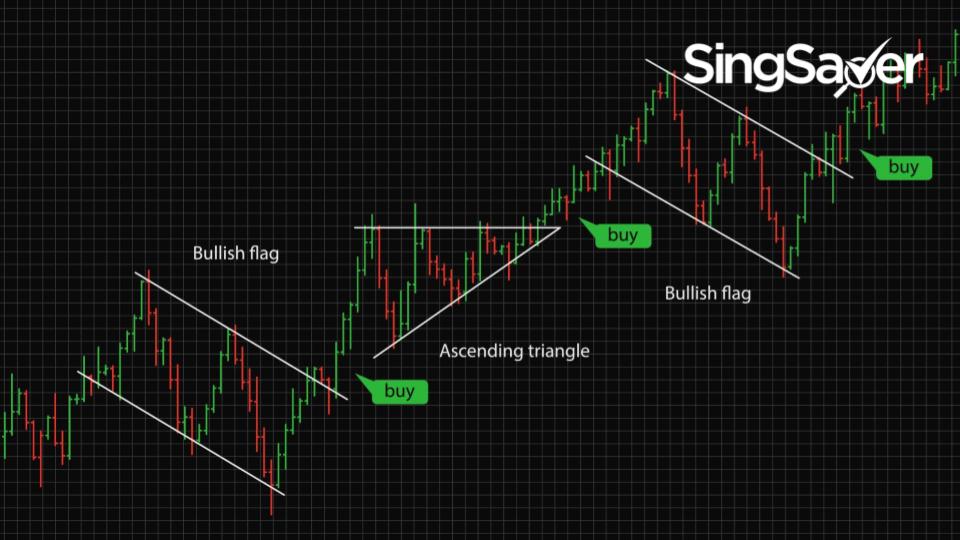
Perhaps most relevant is the fact that candlestick charts are capable of building patterns that can be used to indicate price directions.
This powerful and useful ability is why market-timing traders have come to rely on candlestick patterns when attempting to profit off market movements.
So if you’re looking to try your hand at day trading too, you should arm yourself by learning some basic candlestick patterns and what they mean.
How do you read a candlestick chart?
As candlestick patterns are found in a candlestick chart, you’ll first need to learn how to read one. Here are the main points to take note of when studying a candlestick chart.
- Each candlestick indicates one trading period (usually, a day).
- Candlesticks are arranged from left to right, in chronological order.
- Candlesticks come in two colours, usually green for positive price movement (or a price increase), and red for a negative one (or a price decrease). Some charts may employ other colour schemes, such as black/white, blue/yellow, etc.
- The body of the candlestick is made up of the opening and the closing prices of the day.
- On a day when the closing price is higher than the opening price (i.e., a price increase), the candlestick is coloured green.
- On a day when the closing price is lower than the opening price (i.e., a price decrease), the candle is coloured red.
- The wicks (the thin lines) above and below the candle indicate the highest and lowest price points during the trading day. They can be used to help gauge market sentiment.
Of long bulls and short bears - making sense of market jargon
Generally speaking, we are conditioned to think of market movements in a rather simplistic manner: up means good, and down means bad.
While this is broadly true when we’re talking about the economy, in investing, it’s not so straightforward.
Professional investors know that there is money to be made in any direction the market moves, and employ advanced trading methods like options and futures to profit accordingly.
In order to understand the significance of the candlestick patterns we will be discussing today, it helps to first know the following terms.
- Bulls - Traders who favour prices going up
- Long - A trading position that makes money when prices go higher
- Bears - Traders who favour prices going down
- Short - A trading position that makes money when prices go lower
- Bear market - A period of falling market prices
- Bull market - A period of rising market prices
12 candlestick patterns you need to learn
| Candlestick pattern name | Potential market direction |
| Hammer | Up |
| Bullish Engulfing | Up |
| Morning Star | Up |
| Three White Soldiers | Up |
| Hanging Man | Down |
| Bearish Engulfing | Down |
| Evening Star | Down |
| Three Black Crows | Down |
| Doji | Neutral/undecided |
| Spinning Top | Neutral/undecided |
| Falling Three | Neutral/undecided |
| Rising Three | Neutral/undecided |
Bullish candlestick patterns
Hammer

The Hammer is easily identifiable by its short body and long wick. This pattern tells us that although the day saw significant selling pressure, ultimately there was stronger buying pressure, causing the day to close at a higher price.
A Hammer is usually found at the bottom of a downward trend, and indicates a coming reversal is likely. Hence, it is classified as a bullish candlestick pattern.
Bullish Engulfing

This pattern involves two consecutive candlesticks, with the first one in red completely engulfed by the second one in green.
The sizes of the candlesticks point out that although the second day opened lower than the first, bullish action pushed up the price, causing the day to close higher. This is an obvious sign of a win for buyers.
Morning Star

A Morning Star pattern is made up of three candlesticks: a short one, a long red one on the left, and a long green one on the right.
The appearance of this pattern usually signals the ending of an extended period of falling prices, and that prices will soon start to rally to the upside.
Three White Soldiers

Another three-candlestick pattern, the Three White Soldiers are formed when three consecutive green candlesticks appear one after another. Most importantly, each candlestick must close higher than the one before.
This pattern is a strong bullish signal that indicates steady buying action at the end of a downward trend.
Bearish candlestick patterns
Hanging Man

You may notice that the Hanging Man looks similar to the Hammer (see above) pattern. However, the difference lies in where it appears.
In the case of Hanging Man, it comes at the end of a rising trend. This tells us that a large sell-off happened during the day. While the bulls managed to push the prices back up, the lower price at close signals the start of a price decline.
Bearish Engulfing

In the Bearish Engulfing pattern, a small green candlestick is followed by a larger red one, completely engulfing it.
This pattern usually appears at the peak of a market uptrend, and warns of an impending downturn. The longer the red candle is, the more significant the pullback is expected to be.
Evening Star

Just as the Morning Star (see above) signals a bullish trend, its counterpart, the Evening Star, heralds a bearish one.
In this pattern, a short green candle - aka the star - is flanked by a large green one on the left, and a large red one on the right. Its appearance points to a reversal of an uptrend.
Another thing to note is the difference between the first, green candle and the third, red one. If the red one is much larger than the green one, the coming downtrend is expected to be severe.
Three Black Crows

In Three Black Crows, we can see three red candles in a row, with each one closing lower than the other.
This is a bearish indicator, as this shows that selling pressure had outstripped buying pressure for three days in a row. Expect a downtrend to follow shortly.
Neutral or undecided candlestick patterns
When you see the following candlestick patterns, it indicates that the market is undecided, with neither the bulls nor the bears getting the upper hand. This may lead to a period of sideways price action.
Doji

Formed by two candles with short or small bodies appearing next to each other, the Doji pattern is a neutral indicator. It communicates a more or less evenly matched struggle between buyers and sellers.
Spinning Top

The Spinning Top looks similar to the Doji, but has longer wicks (the thin lines). This pattern is usually taken as a sign of indecision in the market, with bears pulling the price down, while bulls push it up.
Spinning Tops usually appear at the end of an upward or downward trend, marking a period of consolidation before the next movement begins.
Falling Three

The appearance of three green candles interrupting a procession of red ones is usually a sign that an uptrend is on the horizon (à la Three White Soldiers - see above). However, in the case of the Falling Three, notice that their sizes are smaller than the two red candles flanking them.
This indicates that buying pressure is present, but not strong enough to overcome the current selling pressure. Hence, after this temporary interruption, the downtrend is expected to continue.
Rising Three

On the other hand, the Rising Three - a trio of red candlesticks sandwiched by two green ones - creates a temporary pause in an uptrend. However, as the green candles on both sides are much larger, the market is expected to continue moving in an upwards direction.
As with the Falling Three in the previous entry, the Rising Three tells us that selling pressure is present, but not strong enough to overcome buying pressure.
Read these next:
Best Forex Brokers In Singapore For Avid Traders
moomoo Review: Low Cost Trades, An iPhone 13, S$200 Stock Coupons, And More
Best CFD Brokers In Singapore For Every Investor Type
Investing In Exchange Traded Funds (ETFs): A Newbie’s Guide To Getting Started
Gold Investment In Singapore: The Gold Standard Guide
Similar articles
What Is Emotional Investing And How To Avoid It
DBS Vickers Review: Beginner-Friendly Brokerage With Competitive Rates And Wide Range Of Investments
What’s Forex Trading, And How To Get Started In Singapore
The Costs of Layoffs and How They Affect Stock Prices
Should You ‘Buy The Dip’ When The Market Is Down?
Trading Lingo from Wall Street Bets Decoded
Options Trading Guide: An Option For Advanced Investors To Profit
Forex — How Investors Can Think About High-Risk Investments
 Back to Blog

